Truflation: US Inflation Update April 2023
Published 09 May, 2023
While last month marked a significant drop in US inflation to 5%, this was not enough to dissuade the Federal Reserve from continuing its rate-hiking cycle, as the central bank remains firmly focused on reaching its 2% inflation target. In the May FOMC meeting, policymakers opted for another 25 basis point increase and insisted that the US banking sector remains "sound and resilient" despite the recent turmoil.
However, while officials are clearly concerned that inflation is not coming down fast enough, Truflation's index currently shows US inflation at 3.88% (as of May 8, 2023) - significantly lower than the government's reported figure. With millions of data points measured in real-time, Truflation's US CPI index is 30 times faster than official numbers, providing a more accurate estimate of US consumer prices.
Nevertheless, we expect the April release to reflect renewed inflationary pressures as higher oil prices feed through to key sectors. This could surprise the market, causing volatility and driving the Fed to consider further monetary tightening. Let's dig deeper into the data for a clearer picture of US inflation.
Recent Inflation trends
The annual US Consumer Price Index (CPI), as the US Bureau of Labor Statistics (BLS) reported, saw a significant drop from 6% in February 2023 to 5% in March. Other economic indicators show a mixed picture: while GDP growth slowed from 2.9% in Q4 2022 to 1.1% in Q1 2023, the labor market remains stubbornly strong. As such, April’s inflation release is an important indicator that will likely inform the Fed’s next interest rate decision.
Following the significant drop in March, the market’s expectations for April’s inflation numbers are uncertain, ranging from 4.8% to 5.2%. Truflation’s data shows that the BLS release will come in at the upper end of this range at 5.1%, driven by accelerated price rises in the utilities, fuel, transportation, and clothing sectors.
We expect the announcement to raise questions about the Fed’s next interest rate decision. In its May FOMC meeting minutes, the central bank reiterated its firm commitment to a 2% inflation target and said it wouldn't hesitate to tighten monetary policy further if inflation remains sticky. With CPI on the rise again, the potential for another rate hike this year is back on the table.
Key drivers of lower inflation
The sectors driving higher estimates for April’s BLS inflation numbers are transportation, utilities, and apparel. Higher prices in these sectors are predominantly driven by the increase in oil prices, leading to higher costs of goods rather than services.

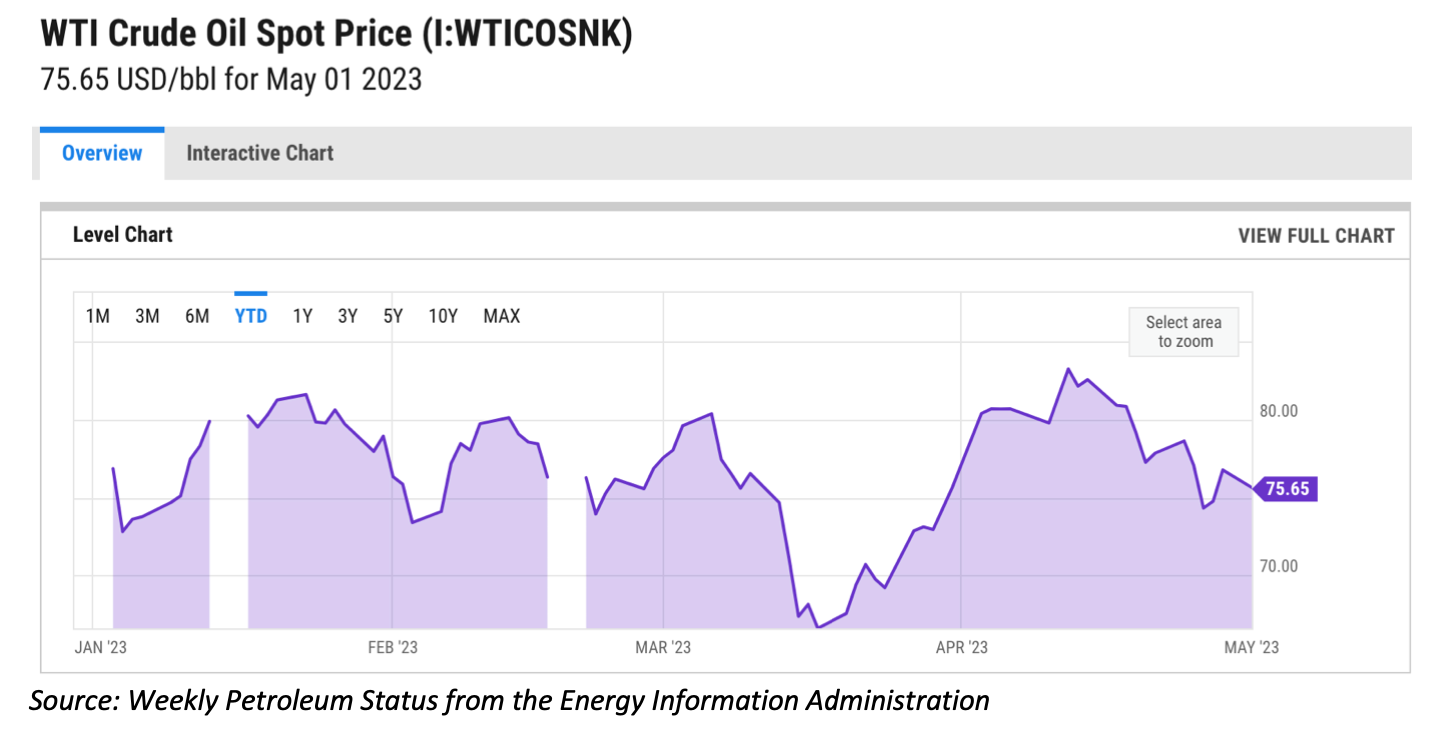
- Following OPEC’s recent move to cut oil production by 1.66 million barrels per day, and with demand for oil increasing in China, WTI oil prices have reached a four-month high of $83 per barrel.
- This, in turn, has driven up fuel prices by 4.76% in April compared to the month before. The cost of a gallon of gas remains lower than a year ago, but there is room for further price growth in the short term, stretching the average American’s budget even thinner.
- The utility sector is seeing a reversal from the previous trend of month-over-month declining inflation, registering a 0.35% increase between March and April. The electricity portion, which accounts for 3.3% of total household expenditure, is responsible for the increase in utilities, with prices up 1.42% MoM.
- However, despite rising oil prices, the utilities sector’s natural gas, fuel oil, and water components have declined MoM. The bad news is that rising oil prices in April will likely feed through to higher utility costs going forward.
- Prices in the transportation sector have continued to increase for the fifth month in a row, up 2.12% MoM. Both new and used vehicle prices have been rising due to supply chain issues, which caused scarcity, which has driven up the prices of used cars.
- Prices in the apparel category have also increased by 1.85% MoM, driven largely by higher cotton commodity prices and rising import duties, which have inflated logistical costs.
- However, we expect to finally see a slowdown in apparel price increases as cotton prices drop. To help matters, inventory levels are rising while consumer demand is waning.
Bucking the trend: Housing, healthcare, and food
- Price rises in the food, and non-alcoholic beverages category are still slowing as the shift away from eating out continues. Consumers eat more at home or choose cheaper restaurants, though grocery prices remain elevated, contributing to overall inflation.
- Between March and April, food prices have risen 0.35% – slower than the 0.54% increase between February and March, but still rising due to high labor and transportation costs. This marks another increase from already elevated levels, hurting the wallets of the average American.
- The housing category is finally cooling, with prices up 0.38% MoM, compared to a 1.21% rise between February and March. However, with 15- and 30-year mortgage rates declining, activity in the market has increased, which could lead to further price increases in the medium term.
- Indeed, the number of house sales has continued to increase, up from 550k in September to 683k in March 2023, according to the US Census Bureau. Meanwhile, average and median prices increased by 13% and 4% between February and March, respectively.
- Healthcare prices have declined for the third month in a row, down 0.41% from the previous month. The main factors driving this trend are lower insurance premiums and declining medical services costs, potentially due to the lower number of hospitalizations post-pandemic.
- The communication category also saw prices decline by 0.2% MoM, primarily driven by cellular communication costs dropping as a result of increased promotional activity.
About Truflation
Truflation provides independent inflation indices based on 30+ different data partners/sources and more than 12 million product prices across the US. The indices are released daily, making it one of the world's most up-to-date and comprehensive inflation measurement tools. Truflation has been leveraging its measurement tool to predict the BLS CPI number. Over the past six months, Truflation has accurately predicted outcomes for two months, with a deviation of only 20 basis points for the third, which remained the closest to the market's projection. February’s prediction missed the mark by 60 basis points due to misaligned housing data.
Privacy Policy | © 2024. Truflation - All Rights Reserved.